optuna.visualization.matplotlib.plot_timeline
- optuna.visualization.matplotlib.plot_timeline(study)[source]
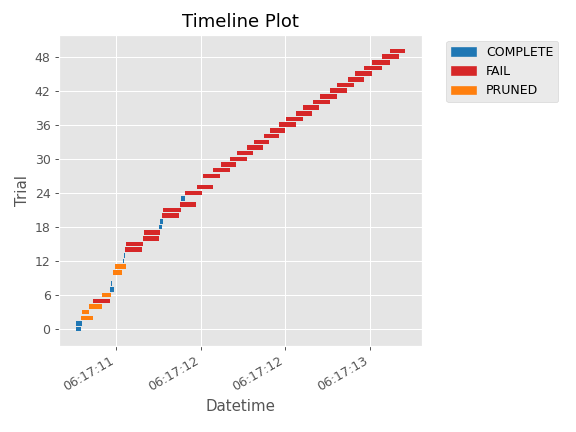
Plot the timeline of a study.
See also
Please refer to
optuna.visualization.plot_timeline()for an example.Example
The following code snippet shows how to plot the timeline of a study.
import time

import optuna


def objective(trial):
    x = trial.suggest_float("x", 0, 1)
    time.sleep(x * 0.1)
    if x > 0.8:
        raise ValueError()
    if x > 0.4:
        raise optuna.TrialPruned()
    return x ** 2


study = optuna.create_study(direction="minimize")
study.optimize(
    objective, n_trials=50, n_jobs=2, catch=(ValueError,)
)

optuna.visualization.matplotlib.plot_timeline(study)
- Parameters:
study (Study) – A
Studyobject whose trials are plotted with their lifetime.- Returns:
A
matplotlib.axes.Axesobject.- Return type:
Note
Added in v3.2.0 as an experimental feature. The interface may change in newer versions without prior notice. See https://github.com/optuna/optuna/releases/tag/v3.2.0.