optuna.visualization.matplotlib.plot_hypervolume_history
- optuna.visualization.matplotlib.plot_hypervolume_history(study, reference_point)[source]
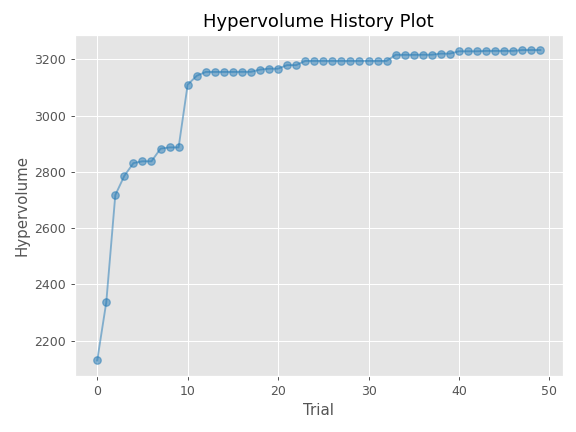
Plot hypervolume history of all trials in a study with Matplotlib.
Example
The following code snippet shows how to plot optimization history.
import optuna
import matplotlib.pyplot as plt


def objective(trial):
    x = trial.suggest_float("x", 0, 5)
    y = trial.suggest_float("y", 0, 3)

    v0 = 4 * x ** 2 + 4 * y ** 2
    v1 = (x - 5) ** 2 + (y - 5) ** 2
    return v0, v1


study = optuna.create_study(directions=["minimize", "minimize"])
study.optimize(objective, n_trials=50)

reference_point=[100, 50]
optuna.visualization.matplotlib.plot_hypervolume_history(study, reference_point)
plt.tight_layout()
Note
You need to adjust the size of the plot by yourself using
plt.tight_layout()orplt.savefig(IMAGE_NAME, bbox_inches='tight').- Parameters:
- Returns:
A
matplotlib.axes.Axesobject.- Return type:
Note
Added in v3.3.0 as an experimental feature. The interface may change in newer versions without prior notice. See https://github.com/optuna/optuna/releases/tag/v3.3.0.