optuna.visualization.matplotlib.plot_terminator_improvement
- optuna.visualization.matplotlib.plot_terminator_improvement(study, plot_error=False, improvement_evaluator=None, error_evaluator=None, min_n_trials=20)[source]
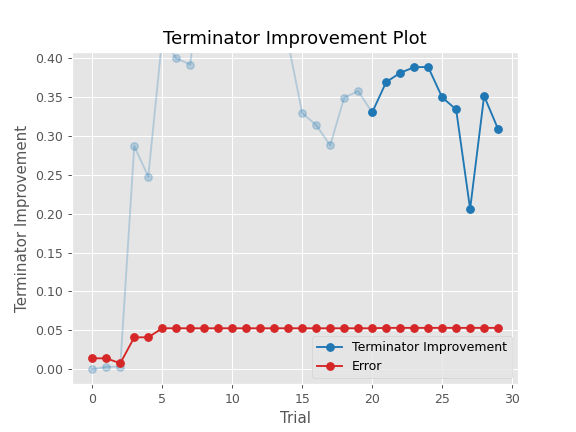
Plot the potentials for future objective improvement.
This function visualizes the objective improvement potentials, evaluated with
improvement_evaluator. It helps to determine whether we should continue the optimization or not. You can also plot the error evaluated witherror_evaluatorif theplot_errorargument is set toTrue. Note that this function may take some time to compute the improvement potentials.See also
Please refer to
optuna.visualization.plot_terminator_improvement().Example
The following code snippet shows how to plot improvement potentials, together with cross-validation errors.
from lightgbm import LGBMClassifier
from sklearn.datasets import load_wine
from sklearn.model_selection import cross_val_score
from sklearn.model_selection import KFold
import optuna
from optuna.terminator import report_cross_validation_scores
from optuna.visualization.matplotlib import plot_terminator_improvement

def objective(trial):
    X, y = load_wine(return_X_y=True)
    clf = LGBMClassifier(
        reg_alpha=trial.suggest_float("reg_alpha", 1e-8, 10.0, log=True),
        reg_lambda=trial.suggest_float("reg_lambda", 1e-8, 10.0, log=True),
        num_leaves=trial.suggest_int("num_leaves", 2, 256),
        colsample_bytree=trial.suggest_float("colsample_bytree", 0.4, 1.0),
        subsample=trial.suggest_float("subsample", 0.4, 1.0),
        subsample_freq=trial.suggest_int("subsample_freq", 1, 7),
        min_child_samples=trial.suggest_int("min_child_samples", 5, 100),
    )
    scores = cross_val_score(clf, X, y, cv=KFold(n_splits=5, shuffle=True))
    report_cross_validation_scores(trial, scores)
    return scores.mean()

study = optuna.create_study()
study.optimize(objective, n_trials=30)

plot_terminator_improvement(study, plot_error=True)
- Parameters:
study (Study) – A
Studyobject whose trials are plotted for their improvement.plot_error (bool) – A flag to show the error. If it is set to
True, errors evaluated byerror_evaluatorare also plotted as line graph. Defaults toFalse.improvement_evaluator (BaseImprovementEvaluator | None) – An object that evaluates the improvement of the objective function. Default to
RegretBoundEvaluator.error_evaluator (BaseErrorEvaluator | None) – An object that evaluates the error inherent in the objective function. Default to
CrossValidationErrorEvaluator.min_n_trials (int) – The minimum number of trials before termination is considered. Terminator improvements for trials below this value are shown in a lighter color. Defaults to
20.
- Returns:
A
matplotlib.axes.Axesobject.- Return type:
Note
Added in v3.2.0 as an experimental feature. The interface may change in newer versions without prior notice. See https://github.com/optuna/optuna/releases/tag/v3.2.0.