optuna.visualization.matplotlib.plot_intermediate_values
- optuna.visualization.matplotlib.plot_intermediate_values(study)[源代码]
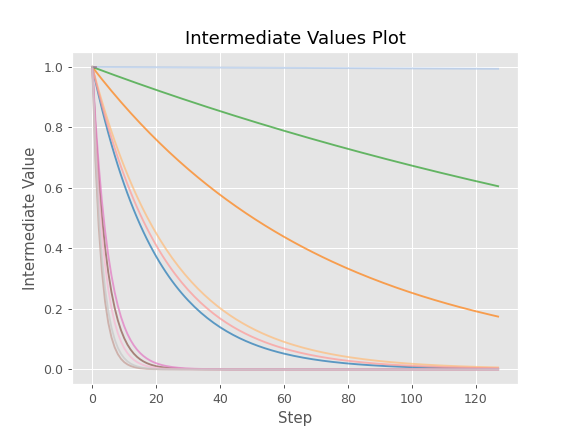
Plot intermediate values of all trials in a study with Matplotlib.
示例
The following code snippet shows how to plot intermediate values.
import optuna


def f(x):
    return (x - 2) ** 2


def df(x):
    return 2 * x - 4


def objective(trial):
    lr = trial.suggest_float("lr", 1e-5, 1e-1, log=True)

    x = 3
    for step in range(128):
        y = f(x)

        trial.report(y, step=step)
        if trial.should_prune():
            raise optuna.TrialPruned()

        gy = df(x)
        x -= gy * lr

    return y


sampler = optuna.samplers.TPESampler(seed=10)
study = optuna.create_study(sampler=sampler)
study.optimize(objective, n_trials=16)

optuna.visualization.matplotlib.plot_intermediate_values(study)
参见
Please refer to
optuna.visualization.plot_intermediate_values()for an example.- 参数
study (optuna.study.Study) – A
Studyobject whose trials are plotted for their intermediate values.- 返回
A
matplotlib.axes.Axesobject.- 返回类型
matplotlib.axes._axes.Axes
备注
Added in v2.2.0 as an experimental feature. The interface may change in newer versions without prior notice. See https://github.com/optuna/optuna/releases/tag/v2.2.0.