optuna.visualization.matplotlib.plot_intermediate_values
- optuna.visualization.matplotlib.plot_intermediate_values(study)[source]
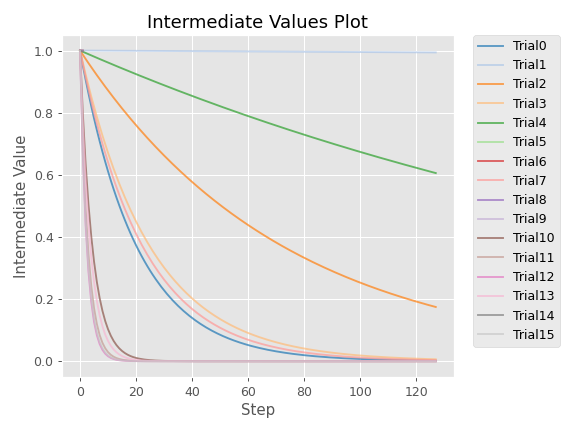
Plot intermediate values of all trials in a study with Matplotlib.
Note
Please refer to matplotlib.pyplot.legend to adjust the style of the generated legend.
Example
The following code snippet shows how to plot intermediate values.
import optuna


def f(x):
    return (x - 2) ** 2


def df(x):
    return 2 * x - 4


def objective(trial):
    lr = trial.suggest_float("lr", 1e-5, 1e-1, log=True)

    x = 3
    for step in range(128):
        y = f(x)

        trial.report(y, step=step)
        if trial.should_prune():
            raise optuna.TrialPruned()

        gy = df(x)
        x -= gy * lr

    return y


sampler = optuna.samplers.TPESampler(seed=10)
study = optuna.create_study(sampler=sampler)
study.optimize(objective, n_trials=16)

optuna.visualization.matplotlib.plot_intermediate_values(study)
See also
Please refer to
optuna.visualization.plot_intermediate_values()for an example.- Parameters
study (Study) – A
Studyobject whose trials are plotted for their intermediate values.- Returns
A
matplotlib.axes.Axesobject.- Return type
Axes
Note
Added in v2.2.0 as an experimental feature. The interface may change in newer versions without prior notice. See https://github.com/optuna/optuna/releases/tag/v2.2.0.