optuna.visualization.matplotlib.plot_edf
- optuna.visualization.matplotlib.plot_edf(study, *, target=None, target_name='Objective Value')[source]
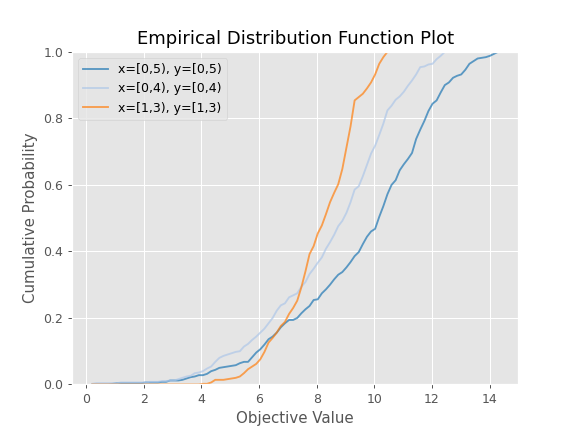
Plot the objective value EDF (empirical distribution function) of a study with Matplotlib.
Note that only the complete trials are considered when plotting the EDF.
See also
Please refer to
optuna.visualization.plot_edf()for an example, where this function can be replaced with it.Note
Please refer to matplotlib.pyplot.legend to adjust the style of the generated legend.
Example
The following code snippet shows how to plot EDF.
import math

import optuna


def ackley(x, y):
    a = 20 * math.exp(-0.2 * math.sqrt(0.5 * (x ** 2 + y ** 2)))
    b = math.exp(0.5 * (math.cos(2 * math.pi * x) + math.cos(2 * math.pi * y)))
    return -a - b + math.e + 20


def objective(trial, low, high):
    x = trial.suggest_float("x", low, high)
    y = trial.suggest_float("y", low, high)
    return ackley(x, y)


sampler = optuna.samplers.RandomSampler(seed=10)

# Widest search space.
study0 = optuna.create_study(study_name="x=[0,5), y=[0,5)", sampler=sampler)
study0.optimize(lambda t: objective(t, 0, 5), n_trials=500)

# Narrower search space.
study1 = optuna.create_study(study_name="x=[0,4), y=[0,4)", sampler=sampler)
study1.optimize(lambda t: objective(t, 0, 4), n_trials=500)

# Narrowest search space but it doesn't include the global optimum point.
study2 = optuna.create_study(study_name="x=[1,3), y=[1,3)", sampler=sampler)
study2.optimize(lambda t: objective(t, 1, 3), n_trials=500)

optuna.visualization.matplotlib.plot_edf([study0, study1, study2])
- Parameters
study (Union[Study, Sequence[Study]]) – A target
Studyobject. You can pass multiple studies if you want to compare those EDFs.target (Optional[Callable[[FrozenTrial], float]]) –
A function to specify the value to display. If it is
Noneandstudyis being used for single-objective optimization, the objective values are plotted.Note
Specify this argument if
studyis being used for multi-objective optimization.target_name (str) – Target’s name to display on the axis label.
- Returns
A
matplotlib.axes.Axesobject.- Return type
Axes
Note
Added in v2.2.0 as an experimental feature. The interface may change in newer versions without prior notice. See https://github.com/optuna/optuna/releases/tag/v2.2.0.