optuna.visualization.matplotlib.plot_contour
- optuna.visualization.matplotlib.plot_contour(study, params=None, *, target=None, target_name='Objective Value')[source]
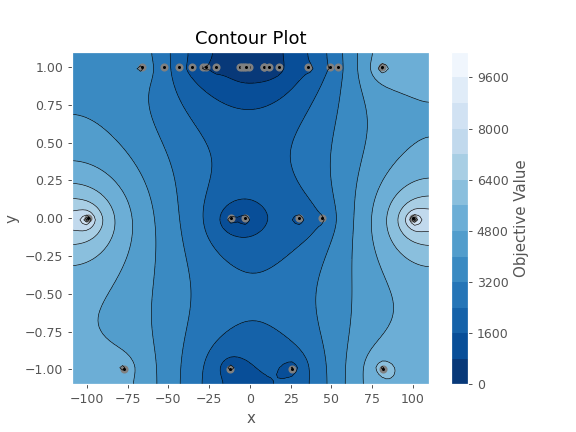
Plot the parameter relationship as contour plot in a study with Matplotlib.
Note that, if a parameter contains missing values, a trial with missing values is not plotted.
See also
Please refer to
optuna.visualization.plot_contour()for an example.Warning
Output figures of this Matplotlib-based
plot_contour()function would be different from those of the Plotly-basedplot_contour().Example
The following code snippet shows how to plot the parameter relationship as contour plot.
import optuna


def objective(trial):
    x = trial.suggest_float("x", -100, 100)
    y = trial.suggest_categorical("y", [-1, 0, 1])
    return x ** 2 + y


sampler = optuna.samplers.TPESampler(seed=10)
study = optuna.create_study(sampler=sampler)
study.optimize(objective, n_trials=30)

optuna.visualization.matplotlib.plot_contour(study, params=["x", "y"])
- Parameters
study (Study) – A
Studyobject whose trials are plotted for their target values.params (Optional[List[str]]) – Parameter list to visualize. The default is all parameters.
target (Optional[Callable[[FrozenTrial], float]]) –
A function to specify the value to display. If it is
Noneandstudyis being used for single-objective optimization, the objective values are plotted.Note
Specify this argument if
studyis being used for multi-objective optimization.target_name (str) – Target’s name to display on the color bar.
- Returns
A
matplotlib.axes.Axesobject.- Return type
Axes
Note
The colormap is reversed when the
targetargument isn’tNoneordirectionofStudyisminimize.Note
Added in v2.2.0 as an experimental feature. The interface may change in newer versions without prior notice. See https://github.com/optuna/optuna/releases/tag/v2.2.0.