optuna.visualization.matplotlib.plot_pareto_front
-
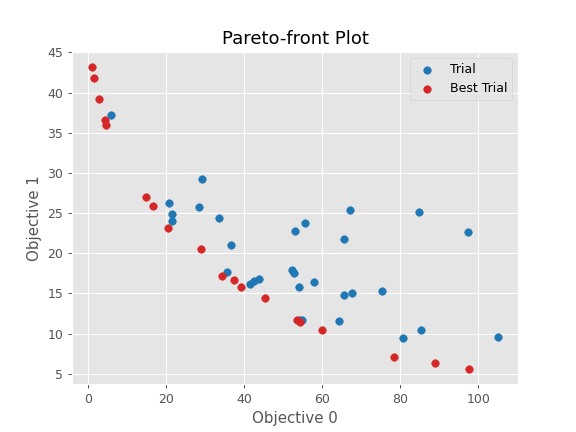
optuna.visualization.matplotlib.plot_pareto_front(study, *, target_names=None, include_dominated_trials=True, axis_order=None)[source]¶ Plot the Pareto front of a study.
See also
Please refer to
optuna.visualization.plot_pareto_front()for an example.Example
The following code snippet shows how to plot the Pareto front of a study.
import optuna


def objective(trial):
    x = trial.suggest_float("x", 0, 5)
    y = trial.suggest_float("y", 0, 3)

    v0 = 4 * x ** 2 + 4 * y ** 2
    v1 = (x - 5) ** 2 + (y - 5) ** 2
    return v0, v1


study = optuna.create_study(directions=["minimize", "minimize"])
study.optimize(objective, n_trials=50)

optuna.visualization.matplotlib.plot_pareto_front(study)
- Parameters
study (optuna.study.study.Study) – A
Studyobject whose trials are plotted for their objective values.target_names (Optional[List[str]]) – Objective name list used as the axis titles. If
Noneis specified, “Objective {objective_index}” is used instead.include_dominated_trials (bool) – A flag to include all dominated trial’s objective values.
axis_order (Optional[List[int]]) – A list of indices indicating the axis order. If
Noneis specified, default order is used.
- Returns
A
matplotlib.axes.Axesobject.- Raises
ValueError – If the number of objectives of
studyisn’t 2 or 3.- Return type
matplotlib.axes._axes.Axes
Note
Added in v2.8.0 as an experimental feature. The interface may change in newer versions without prior notice. See https://github.com/optuna/optuna/releases/tag/v2.8.0.